This step-by-step guide uses the Official telegraph vSphere plugin to pull metrics from vCenter. We will pull metrics such as compute, network and storage resources. Before starting with this guide, I assume you have a freshly installed operating system, ubuntu 20. so let’s begin our work.
Install Grafana on Ubuntu
This tutorial tested on freshly installed OS Ubuntu 20.04. Start your Grafana installation.
wget https://dl.grafana.com/oss/release/grafana_7.1.3_amd64.deb
sudo dpkg -i grafana_7.1.3_amd64.deb
Now start and enable your Grafana service.
sudo systemctl start grafana-server.service
sudo systemctl enable grafana-server.service
Check Grafana service status.
sudo systemctl status grafana-server.service
At this point, Grafana is installed, and you can log in to your Grafana by following
url: http://[your Grafana server ip]:3000
The default username/password is admin/admin
Upon the first login, Grafana will ask you to change the password.
Be careful HTTP is not a secure protocol. You can further secure it by putting SSL certificates.
Install Influx DB
Inquire about the available InfluxDB version in your apt-cache by the following command.
sudo apt-cache policy influxdb
It will be the last stable version of InfluxDB. We will use a later version 1.8 of InfluxDB, so we will update the apt cache first and add the required information to the repository.
wget -qO- https://repos.influxdata.com/influxdb.key | sudo apt-key add –
source /etc/lsb-release
echo “deb https://repos.influxdata.com/${DISTRIB_ID,,} ${DISTRIB_CODENAME} stable” | sudo tee /etc/apt/sources.list.d/influxdb.list
sudo apt update
sudo apt-cache policy influxdb
sudo apt update
sudo apt-cache policy influxdb
sudo apt install influxdb -y
Now time to check the status and ensure that it sustains over the reboot.
sudo systemctl start influxdb
sudo systemctl status influxdb
sudo systemctl enable influxdb
The InfluxDB will listen on port 8086, and if your server is on the internet, then depending on any existing firewall rules, anybody may be able to query the server using the URL
http://[your domain name or ip]:8086/metrics
on my local machine where I am doing this test, is not having any firewall enabled, but if you have allowed or using public IPs, you can prevent direct access by doing these commands
iptables -A INPUT -p tcp -s localhost –dport 8086 -j ACCEPT
iptables -A INPUT -p tcp –dport 8086 -j DROP
Install Telegraf
Now we are going to install a telegraf.
sudo apt install telegraf -y
Start Telegraf and ensure it starts in case of reboot.
sudo systemctl start telegraf
sudo systemctl status telegraf
sudo systemctl enable telegraf
Configure Telegraf to pull Monitoring metrics from vCenter, so here we will configure Telegraf main configuration file:
In this /etc/telegraf/telegraf first, you need to add information for influxdb.
change your influxdb credentials.
[[outputs.influxdb]]urls = [“http://<Address_of_influxdb_server>:8086”]database = “vmware”
timeout = “0s”
#only with if you are using authentication for DB
#username = “USERNAME_OF_DB”
#password = “PASSWD_OF_DB”
# Read metrics from VMware vCenter
[[inputs.vsphere]]## List of vCenter URLs to be monitored. These three lines must be uncommented
## and edited for the plugin to work.
vcenters = [ “https://<vCenter_IP>/sdk” ]username = “administrator@vsphere.local”
password = “PASSWD”
#
## VMs
## Typical VM metrics (if omitted or empty, all metrics are collected)
vm_metric_include = [
“cpu.demand.average”,
“cpu.idle.summation”,
“cpu.latency.average”,
“cpu.readiness.average”,
“cpu.ready.summation”,
“cpu.run.summation”,
“cpu.usagemhz.average”,
“cpu.used.summation”,
“cpu.wait.summation”,
“mem.active.average”,
“mem.granted.average”,
“mem.latency.average”,
“mem.swapin.average”,
“mem.swapinRate.average”,
“mem.swapout.average”,
“mem.swapoutRate.average”,
“mem.usage.average”,
“mem.vmmemctl.average”,
“net.bytesRx.average”,
“net.bytesTx.average”,
“net.droppedRx.summation”,
“net.droppedTx.summation”,
“net.usage.average”,
“power.power.average”,
“virtualDisk.numberReadAveraged.average”,
“virtualDisk.numberWriteAveraged.average”,
“virtualDisk.read.average”,
“virtualDisk.readOIO.latest”,
“virtualDisk.throughput.usage.average”,
“virtualDisk.totalReadLatency.average”,
“virtualDisk.totalWriteLatency.average”,
“virtualDisk.write.average”,
“virtualDisk.writeOIO.latest”,
“sys.uptime.latest”,
]# vm_metric_exclude = [] ## Nothing is excluded by default
# vm_instances = true ## true by default
#
## Hosts
## Typical host metrics (if omitted or empty, all metrics are collected)
host_metric_include = [
“cpu.coreUtilization.average”,
“cpu.costop.summation”,
“cpu.demand.average”,
“cpu.idle.summation”,
“cpu.latency.average”,
“cpu.readiness.average”,
“cpu.ready.summation”,
“cpu.swapwait.summation”,
“cpu.usage.average”,
“cpu.usagemhz.average”,
“cpu.used.summation”,
“cpu.utilization.average”,
“cpu.wait.summation”,
“disk.deviceReadLatency.average”,
“disk.deviceWriteLatency.average”,
“disk.kernelReadLatency.average”,
“disk.kernelWriteLatency.average”,
“disk.numberReadAveraged.average”,
“disk.numberWriteAveraged.average”,
“disk.read.average”,
“disk.totalReadLatency.average”,
“disk.totalWriteLatency.average”,
“disk.write.average”,
“mem.active.average”,
“mem.latency.average”,
“mem.state.latest”,
“mem.swapin.average”,
“mem.swapinRate.average”,
“mem.swapout.average”,
“mem.swapoutRate.average”,
“mem.totalCapacity.average”,
“mem.usage.average”,
“mem.vmmemctl.average”,
“net.bytesRx.average”,
“net.bytesTx.average”,
“net.droppedRx.summation”,
“net.droppedTx.summation”,
“net.errorsRx.summation”,
“net.errorsTx.summation”,
“net.usage.average”,
“power.power.average”,
“storageAdapter.numberReadAveraged.average”,
“storageAdapter.numberWriteAveraged.average”,
“storageAdapter.read.average”,
“storageAdapter.write.average”,
“sys.uptime.latest”,
]# host_metric_exclude = [] ## Nothing excluded by default
# host_instances = true ## true by default
#
## Clusters
cluster_metric_include = [] ## if omitted or empty, all metrics are collected
# cluster_metric_exclude = [] ## Nothing excluded by default
# cluster_instances = false ## false by default
#
## Datastores
datastore_metric_include = [] ## if omitted or empty, all metrics are collected
# datastore_metric_exclude = [] ## Nothing excluded by default
# datastore_instances = false ## false by default for Datastores only
#
## Datacenters
datacenter_metric_include = [] ## if omitted or empty, all metrics are collected
# datacenter_metric_exclude = [ “*” ] ## Datacenters are not collected by default.
# datacenter_instances = false ## false by default for Datastores only
#
## Plugin Settings
## separator character to use for measurement and field names (default: “_”)
# separator = “_”
#
## number of objects to retreive per query for realtime resources (vms and hosts)
## set to 64 for vCenter 5.5 and 6.0 (default: 256)
# max_query_objects = 256
#
## number of metrics to retreive per query for non-realtime resources (clusters and datastores)
## set to 64 for vCenter 5.5 and 6.0 (default: 256)
# max_query_metrics = 256
#
## number of go routines to use for collection and discovery of objects and metrics
# collect_concurrency = 1
# discover_concurrency = 1
#
## whether or not to force discovery of new objects on initial gather call before collecting metrics
## when true for large environments, this may cause errors for time elapsed while collecting metrics
## when false (default), the first collection cycle may result in no or limited metrics while objects are discovered
# force_discover_on_init = false
#
## the interval before (re)discovering objects subject to metrics collection (default: 300s)
# object_discovery_interval = “300s”
#
## timeout applies to any of the api request made to vcenter
# timeout = “60s”
#
## Optional SSL Config
# ssl_ca = “/path/to/cafile”
# ssl_cert = “/path/to/certfile”
# ssl_key = “/path/to/keyfile”
## Use SSL but skip chain & host verification
insecure_skip_verify = true
You only need to change the credential of vcenter and influxdb
Start and enable telegraf service after making the changes.
sudo systemctl restart telegraf
sudo systemctl enable telegraf
Check InfluxDB Metrics
We need to confirm that our metrics are being pushed to InfluxDB and that we can see them.
If you are using authentication then open InfluxDB shell like this
$ influx -username ‘username’ -password ‘PASSWD’
We need to confirm that our metrics pushed to InfluxDB and that we can see them.
If you are using authentication, then open the InfluxDB shell by this:
$ influx
Then
> USE vmware
Using database vmware
Check if there is an inflow of time series metrics.
> SHOW MEASUREMENTS
name: measurements
name
—-
cpu
disk
diskio
kernel
mem
processes
swap
system
vsphere_cluster_clusterServices
vsphere_cluster_mem
vsphere_cluster_vmop
vsphere_datacenter_vmop
vsphere_datastore_datastore
vsphere_datastore_disk
vsphere_host_cpu
vsphere_host_disk
vsphere_host_mem
vsphere_host_net
vsphere_host_power
vsphere_host_storageAdapter
vsphere_host_sys
vsphere_vm_cpu
vsphere_vm_mem
vsphere_vm_net
vsphere_vm_power
vsphere_vm_sys
vsphere_vm_virtualDisk
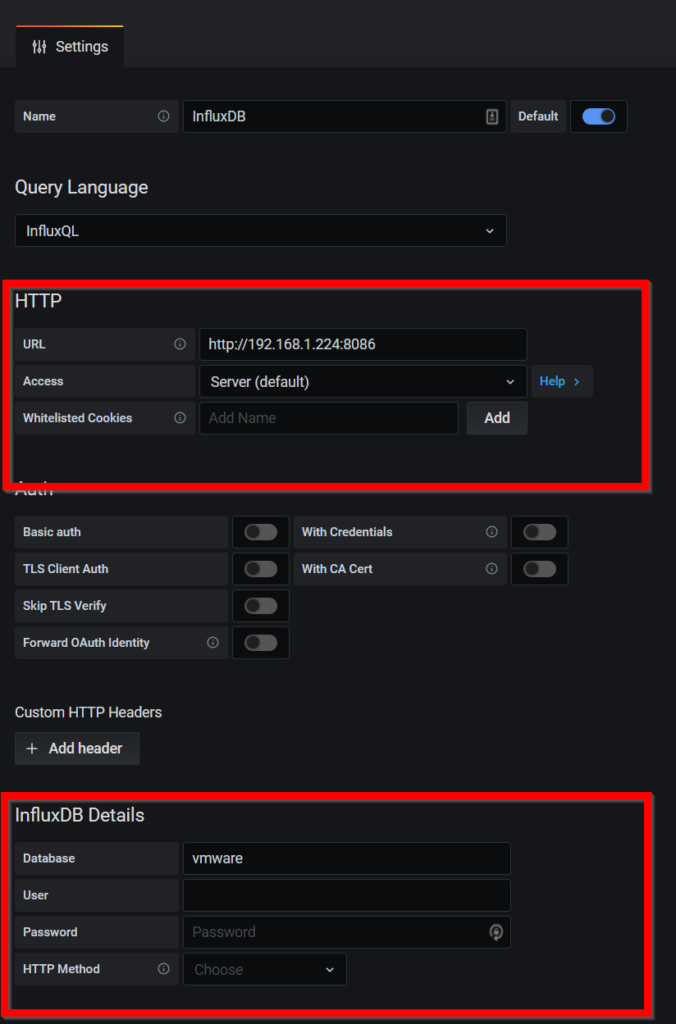
Add InfluxDB Data Source to Grafana
Login to Grafana and add InfluxDB data source
Click on the configuration icon and then click datasource.
Click Add influxDB data source.
Insert all the relevant information under HTTP and influxDB details shown into the red boxes below:
If you used a password in your influxDB you might put it here.
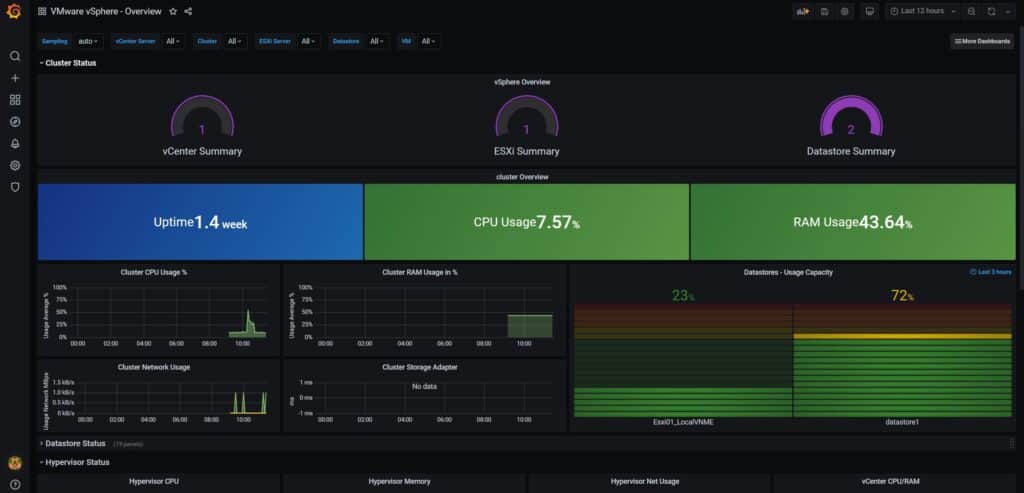
Import Grafana Dashboards
The last action is to create or import Grafana dashboards:
Building a Grafana dashboard is a lengthy process, so we are using a community dashboard built by Jorge de la Cruz.
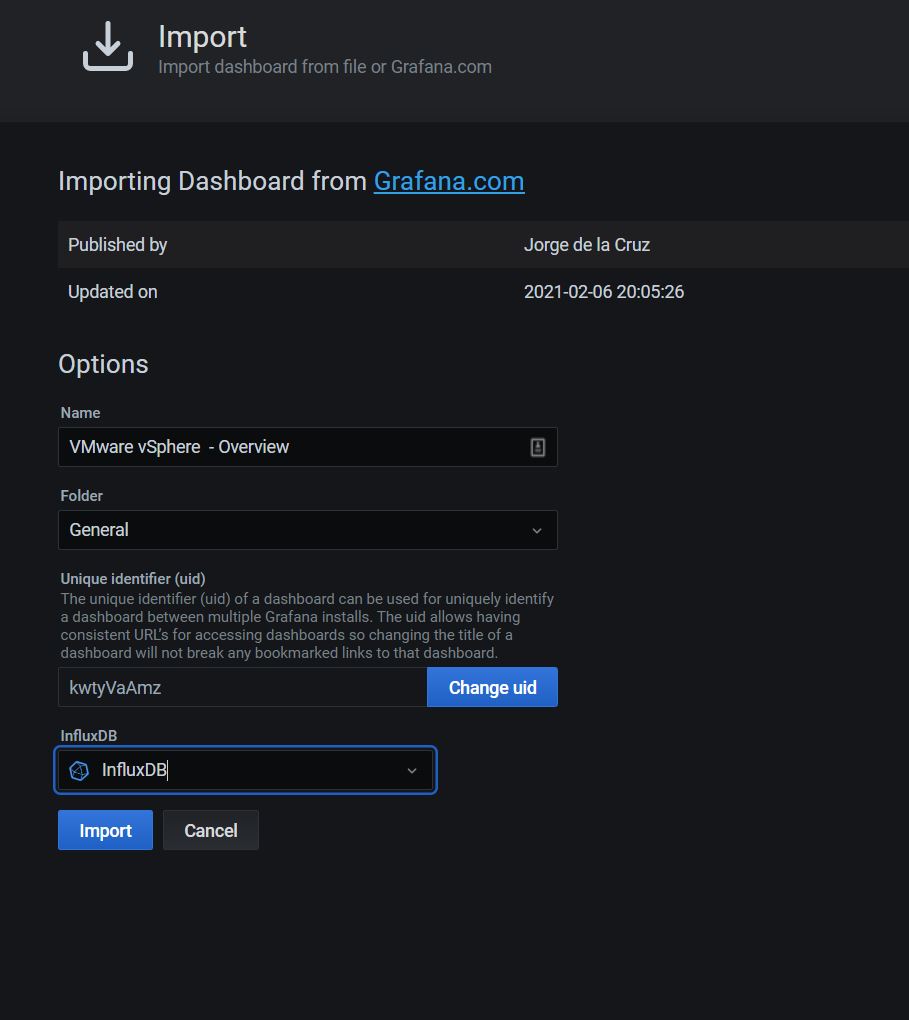
We will import this pre-build Grafana dashboard #8159. The moment you did import, you will see your Grafana dashboard.